
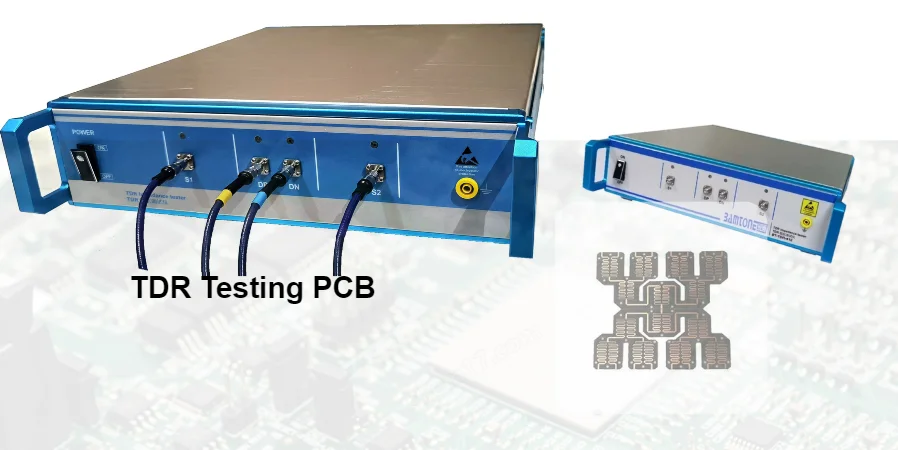
A PCB trace can pass continuity testing yet have the wrong characteristic impedance or a disruptive via transition. Time-domain reflectometry (TDR) sends a fast electrical step into a transmission structure and measures the reflections. It helps engineers assess impedance and locate electrical discontinuities that a DC connectivity test does not characterize.
HilPCB offers TDR and controlled-impedance manufacturing routes for high-speed PCBs and RF PCBs. The useful purchase specification identifies the target structures, measurement method, tolerance and records. A production coupon result and a complete assembled-channel validation answer different questions.
The Science Behind TDR Testing Technology
An impedance change reflects part of the incident signal. A higher or lower impedance produces a different response; an open or short is a limiting case. Multiple reflections, losses and the launch can complicate interpretation, so a waveform feature does not automatically identify a physical defect or its cause.
Reflection and impedance: For an ideal uniform line referenced to Z₀, the reflection coefficient is ρ = Vreflected/Vincident and Z = Z₀ × (1 + ρ)/(1 − ρ). Tektronix's TDR primer explains this relationship. As a hypothetical check, Z₀ = 50 Ω and ρ = +0.05 give approximately 55.26 Ω. A specified 50 Ω ±10% window is 45–55 Ω; use the agreed measurement window, uncertainty and decision rule for an actual acceptance decision.
Time and distance: Reflection delay is round-trip travel time. For an assumed uniform propagation velocity of 1.8 × 10⁸ m/s, a reflection 1 ns after the defined reference plane corresponds to 90 mm along the electrical path. A via or connector changes that path; do not equate it blindly to straight-line board distance.
Spatial resolution: A useful approximation is Δx ≈ v × tᵣ,system / 2. With the same assumed velocity and 100 ps effective system rise time, Δx is about 9 mm. This describes separation of nearby responses, not a guaranteed 9 mm defect-location error. The source, scope, cables and probes all contribute to effective rise time. Faster edges reveal smaller features but can also emphasize launch and transition details outside the intended acceptance window.
Single-ended and differential structures: Specify the measured mode, reference impedance, pair connections and channel deskew. A differential impedance target is not interchangeable with two independent single-ended targets. Match the coupon or test structure to the layer, references, geometry and copper construction being accepted.
Manufacturing Process Integration for Quality Excellence
A useful TDR control plan connects the released stackup to an accessible test structure and a repeatable measurement. Coupons are commonly placed on the fabrication panel; they represent selected construction features rather than every route, via and connector on the finished assembly.
Strategic Quality Control Implementation
1. Pre-Production Validation
Before release, identify controlled-impedance nets, layers, reference planes and nominal values. Model the proposed geometry with the selected material and finished copper. Prototype or first-build coupons then check whether the manufactured construction meets the agreed limits.
- Design verification: Confirm the target, tolerance and eligible geometry together, with written approval for material or stackup changes.
- Test access: Define coupon structures, launches, length and usable measurement windows. A short coupon can be dominated by its launch or end reflection.
- Baseline: Record the approved build and setup so repeat orders can be compared on the same basis.
2. Manufacturing Feedback
Measurements on completed accessible coupons or test structures can inform process control. Compare results with dielectric thickness, finished trace geometry and copper records; use microsections where they help distinguish manufacturing causes. A trend alone does not establish tool wear or material failure.
- Process control: Investigate results against defined hold/retest/disposition rules before releasing the affected lot.
- Trend analysis: Keep setup and extraction rules consistent; distinguish measurement changes from build changes.
- Change control: Review stackup, etch compensation, material and fixture changes before treating results as equivalent.
TDR requires a conductive test structure at the relevant build stage. It is not an automatic real-time measurement of every fabrication operation, and a later conforming coupon does not prove every board feature is conforming.
3. Final Acceptance and Records
Use the purchase specification to define panel or lot sampling, single-ended/differential targets, exclusions near launches, pass/fail extraction and required reports. TDR supplements electrical test, AOI and any specified microsections or channel tests.
- Performance documentation: Tie traces and extracted values to the coupon, panel/lot, stackup and file revision.
- Nonconformance disposition: Preserve failed results, investigation and authorized rework or deviations rather than reporting only passing averages.
- Acceptance scope: State which impedance requirements were checked. TDR alone does not establish environmental life, complete protocol compliance or every electrical specification.
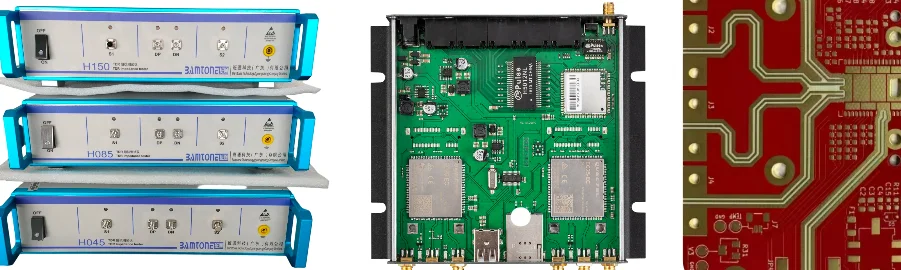
Advanced Applications in Electronics Manufacturing
Failure analysis and diagnostics: An unexpected reflection can narrow the search for an open, short or transition problem. Compare with a known-good structure and confirm the suspected location using the physical layout, microscopy, X-ray or sectioning as appropriate. TDR does not by itself distinguish electromigration from corrosion, fatigue or an intentional discontinuity.
Multilayer PCB characterization: Inner-layer routes can be measured through designed launches and vias. Access and reference-plane continuity matter; a coupon or external connector does not automatically expose every internal net. De-embedding or a suitable reference structure may be needed to separate launch behavior from the line of interest.
Material evaluation: Known line length and measured delay can help compare effective propagation behavior. Extracting a material property requires the actual geometry, field distribution and measurement model. TDR is not a direct universal test of a laminate's datasheet Dk or Df.
Specialized Testing for Critical Applications
Select the test structure and acceptance limits from the actual interconnect and program requirements.
Aerospace and defense electronics: TDR can support board/interconnect impedance acceptance under the specified program. Temperature cycling, humidity, vibration and any qualification evidence are separate requirements; compare pre/post TDR results only where the approved plan calls for it.
Automotive electronics: ECU, radar and other vehicle boards may need controlled-impedance routes and connector-transition diagnostics. The selected interface and customer test plan define the method; a passing coupon is not proof of decades of service or complete functional safety.
Medical electronics: Monitoring and life-support designs need their own safety and performance verification. TDR can check defined interconnect characteristics as part of that plan, while powered function, safety and environmental validation remain separate.
Industrial control: Long cables, connectors and communication channels can benefit from reflection diagnostics. If temperature or vibration is part of the investigation, control the fixture and test conditions; TDR does not itself apply those stresses or establish EMC immunity.
HilPCB TDR Manufacturing and Test Options
HilPCB's high-speed and RF routes include controlled-impedance construction and TDR. Published impedance options are ±10% standard and ±5% for eligible advanced builds, confirmed against the released stackup, geometry, material and measurement plan. These are fabrication acceptance options, not a blanket tolerance for every connector or loaded channel.
- Construction and coupon review: Provide the impedance table, layer/reference mapping, finished copper and proposed coupon requirements. Agree any launch or region-specific structures before panel release.
- Measurement setup: Define effective rise time or bandwidth, stimulus limits, calibration/reference plane, probe/fixture and any de-embedding. Available RF/VNA options require their own frequency band, fixture and acceptance method; an advertised RF band is not a guaranteed TDR resolution.
- Production coverage and reporting: Quote panel/lot sampling, extracted values, trace files, identification and required statistical summaries. The scope can include electrical test, AOI, microsections and material/lot records alongside TDR.
- Flex and rigid-flex circuits: Keep the flex supported in its defined test configuration. Where rigid/flex transitions matter, specify representative structures and distinguish coupon impedance from the assembled transition or bend-life requirement.
- Assembly and fixtures: HilPCB's assembly/box-build routes support fixture and functional-test planning. For assembled-board TDR, identify component loading, safe stimulus, access and terminations before defining a custom setup.
Send Gerber or ODB++ data, drill/fabrication drawings, stackup and impedance table with the order quantity and acceptance/report requirements. Mark whether the objective is production coupon acceptance, prototype channel characterization or fault localization. HilPCB can align fabrication and the quoted TDR/inspection package; fixtures, extra channels, advanced measurements and records should be included explicitly in the quotation.
Depending on the quoted board and fixture, TDR services can include automated production testing, a quoted 100% coverage plan, program options under 30 seconds, custom fixtures and flex expertise, expert diagnostic/SPC interpretation, prototype-to-process feedback, calibrated instrument and resolution choices, and detailed traceable reports. The selected rise time, propagation velocity, calibration and measurement setup define what discontinuities can be resolved; results do not identify every fault mechanism or predict product lifetime.
Frequently Asked Questions
What defects can TDR testing detect that continuity testing misses?
TDR can reveal impedance changes and reflections from geometry, vias, connectors or discontinuities even where DC connectivity passes. The waveform identifies an electrical response; physical inspection or another measurement is often needed to establish the cause.
How does TDR compare with a network analyzer?
TDR emphasizes reflection behavior versus time. A VNA measures frequency-domain S-parameters and can also transform them into a time-domain response. Use the required return loss, insertion loss, mode conversion and time resolution to select the method. Keysight explains the complementary views, masking and resolution limits.
Can TDR be performed on assembled PCBs?
Yes, where the access, safe stimulus and circuit configuration permit it. IC inputs, terminations, protection devices, AC-coupling capacitors and branches affect the response. Agree how the test isolates the intended interconnect and avoids damaging attached devices; a bare coupon and populated channel are different test vehicles.
What resolution can TDR achieve?
Use the effective system rise time and propagation velocity for the specified structure. The approximate 9 mm example above uses 100 ps and 1.8 × 10⁸ m/s; it is not a statement of HilPCB's instrument resolution. Calibration, launch quality and multiple reflections also affect interpretation.
How does TDR affect production throughput?
Estimate loading, probing, channel count, averaging, analysis, retests and reporting for the quoted sampling plan. Testing panel coupons differs from probing many assembled channels. A pilot run can establish cycle time; there is no universal seconds-per-board figure.
What documentation should accompany results?
Specify trace plots or raw data, impedance values and extraction window, coupon/panel/lot identity, file and stackup revision, setup and calibration details, acceptance limits and disposition. Ask the quotation to identify which records, formats and retention are included; calibration traceability needs its own supporting record.